Customer Segmentation Analysis: From Statistical Models to Marketing Strategy
Customer segmentation case study combining PCA, AGNES clustering, and K-Means analysis to create 5 actionable customer profiles. Includes model validation, strategic recommendations, and MMM applications.
Customer Segmentation Analysis: From Statistical Models to Marketing Strategy
Identification of consumer clusters and marketing mix recommendations for a retailer to increase conversion rate and profitability.
For Marketing Managers: Actionable segment profiles and campaign recommendations For MMM Practitioners: PCA dimensionality reduction, AGNES vs K-Means comparison, model validation metrics
Executive Summary
Customer segmentation transforms generic marketing into precision-targeted campaigns. This analysis applies advanced clustering techniques to retail purchase data, identifying five distinct customer segments that inform both strategic marketing decisions and marketing mix modeling optimization.
The project bridges statistical rigor with business application: using Python-based PCA and AGNES clustering, I transformed 2,240 customer records into actionable segment profiles that guide budget allocation, channel strategy, and personalization tactics.
For Marketing Managers
What you’ll find:
- Five customer personas with clear behavioral profiles, channel preferences, and conversion patterns
- Three strategic initiatives backed by academic research: gamified loyalty programs, segment-based personalization, and behavioral pricing tactics
- Implementation roadmaps with expected ROI, test designs, and measurement frameworks
- Channel optimization insights showing where each segment converts best (web vs. catalog vs. in-store)
Key takeaway: High-engagement doesn’t always equal high-spending. Cluster 2 shows the highest engagement score but mid-tier spending—revealing a conversion optimization opportunity worth pursuing.
For MMM Practitioners
What you’ll find:
- Model selection rationale comparing K-Means vs. AGNES with validation metrics (Silhouette scores, Davies-Bouldin Index, WCSS)
- Feature engineering approach creating 11 behavioral variables including Engagement_Score, Spending_Ratio, and promotional responsiveness
- Attribution implications for each segment: channel elasticities, promotion responsiveness, purchase cycle lengths
- Statistical rigor including outlier treatment, correlation analysis, and PCA variance explanation
The Challenge
A retail client needed to move beyond demographic segmentation to understand behavioral drivers of purchase decisions. The business faced three interconnected challenges:
-
Marketing Spend Efficiency (MMM Application)
- Budget allocation based on assumptions rather than segment-specific response curves
- Unclear ROI on promotional campaigns across customer types
- Need for segment-level channel attribution modeling
-
Personalization at Scale (Marketing Execution)
- Generic messaging failing to resonate with diverse customer base
- High web traffic but inconsistent conversion rates
- Loyalty program participation not translating to increased spending
-
Cross-Channel Attribution (Measurement)
- Unclear customer journey patterns across web, catalog, and in-store
- Difficulty attributing conversions to specific touchpoints by customer type
- Need for segment-specific attribution windows and channel weights
The Solution: Apply unsupervised learning to identify natural customer groupings, then develop segment-specific strategies informed by behavioral economics and validated through statistical rigor.
Objective
There were 2 primary objectives:
- Segmentation Development: utilize data analytics to create customer segments which would facilitate the creation of target segments and the understanding of consumer behavior.
- Strategic Recommendations: provide actionable recommendations based on the existing research to better adjust the marketing mix
The Five Segments: Statistical Profiles + Marketing Personas
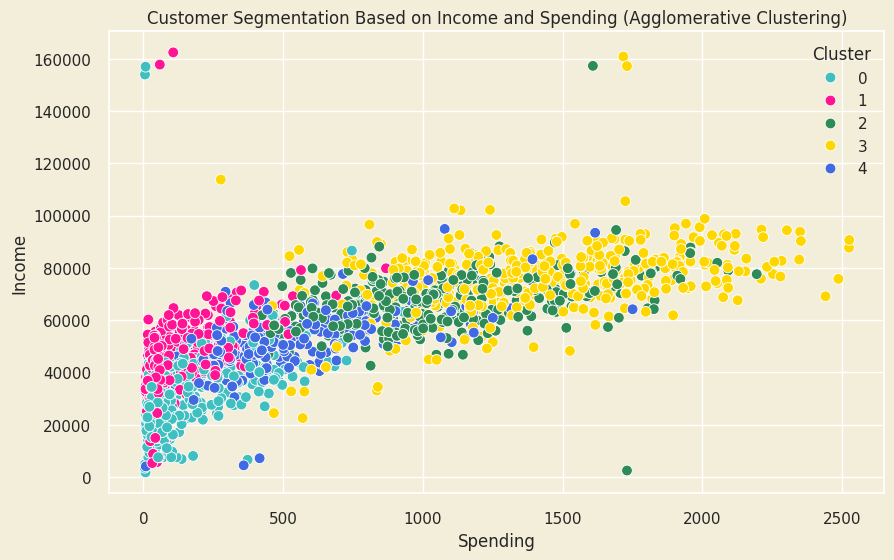
Based on this output provided by the AGNES model, it can be observed the following cluster characteristics:
- Group 0 - Low spending, low income
- Group 1 - High income, low spending
- Group 2 - High income, medium to high spending
- Group 3 - High income, high spending
- Group 4 - Low to medium income, low to medium spending


From the plots above we can observe that cluster 3 spends the most, followed by cluster 2 and 4. Clusters 0 and 1 are on about the same level of spending.
Considering that clusters 3 and 2 consists of above medium household income clients, it is not a surprise that they tend to spend more than the rest. In addition, Cluster 3, as the top earner, spends the most in all categories, with cluster 2 trailing right behind. A major difference in spending can be observed in the Meat product category, where cluster 3 tends to spend double than cluster 2
The first 2 plots below, the Candle and Violin plots, show how each customer cluster interacts with the brand. The metric, the Engagement Score, is a composite measure to quantify customer activity with the brand. It takes into account aspects such as purchase frequency, amount spent, and visit frequency. It is calculated by averaging the standardized values of the engagement factors. The higher the score, the more engaged the customers are.
In the current case, cluster 2 is the most engaged, followed by cluster 3 and 4. As such, it can be considered that loyalty programs and marketing efforts focused on retention should be targeted towards clients in these 3 main clusters.
Even though the distribution of the Engagement Score of cluster 2 is the highest among clusters, the fact that it is not reflected in the spending shows there is an issue at the marketing communication or conversion levels.

The “Count of Total Accepted Promotions by Cluster” confirms there is a conversion issue, especially at the level of Low-Income clients. The individuals who accepted promotions are part of especially of the high income categories. Better targeted campaigns with customized content for each cluster might convert additional customers.
However, unlike promotions, the deals sparked interest. Cluster 4 is by far the most attracted by them, followed by cluster 2 and 0. It seems that cluster 3, the high earning and high spenders, are not attracted by either promotions or deals.


The plot below, “Density of Web Visits and Purchases by Cluster”, shows the following:
- Cluster 0 has the highest monthly web visits, but they fail to convert.
- Cluster 1 is also relatively present and visits the brand online, but, just as cluster 0, they do not convert.
- Cluster 2 has moderate visits per month, but a lot of them tend to convert.
- Cluster 3, even though it has the lowest number of visits, it converts the highest, showing customer determination and loyalty potential through digital means.
- Cluster 4 has a high density of monthly web visits, a lot of them being translated into conversion.
All in all, the graph above shows the potential in the digital area to improve conversion for customer in cluster 0 and cluster 1.

Catalog fails to be an effective medium for the conversion of low income clients from clusters 0 and 1. However, it proves to be effective for cluster 3, and with a limited effectiveness for clusters 2 and 4.

Comparing with the previous plot, it can be observed that Clusters 2 and 3 prefer store purchases, while cluster 4 has approximately the same densities in both situations.
Demographics
Joint plots were used to visually display and analyze cluster distribution across multiple features that define the customers, such as demographics, education, family situation and household income. Some of these jointplots can be seen below.


Based on these plots, the following information was extracted about the clusters:
Cluster 0:
- Most of them are parents, having 1 child.
- Those who are parent are most likely to have a pre-teen child.
- A large part of them did not finish university or have finished an Undergraduate program.
- They tend to be between the ages of 36 and 50, being the youngest group.
- They are low-income.
Cluster 1:
- Medium income per household.
- The majority has at least one child, and a maximum of 5.
- The majority has 50 years or more.
- They have only recently been introduced to the brand.
Cluster 2:
- They are parents, either with no partner or with a maximum of 1 child.
- Most have a teenager.
- In terms of education, they tend to be relatively evenly distributed between no degree or being a postgraduate, with very few individuals being only undergraduates.
- They tend to have a medium to high income.
Cluster 3:
- They are not parents.
- A slight majority are part of couples, while the single people still do count.
- It includes all ages.
- The education background vary, many of them having no degree or had studied a postgraduate program.
Cluster 4:
- They are parents with 1 or maximum 2 children, with varying ages.
- Most of them have finished a university degree, with the largest part having studies a Postgraduates program.
- An important segment of this cluster does not have a partner.
Key Results
The analysis identified five distinct customer segments based on income, spending behavior, and engagement patterns. These are described below, as they appear in the previous analysis:
- Cluster 0 (Low-Income Buyers): Younger parents, mostly with one child, who engage online multiple times before purchasing. They have low spending habits, primarily on wine, meat, and gold.
- Cluster 1 (Medium-Income, Low Spenders): Older parents (50+ years) with low brand familiarity. They show interest in deals but rarely convert online, preferring in-store purchases.
- Cluster 2 (The Engagers): Medium-to-high-income parents with strong online engagement. They are easy to convert, prefer in-store shopping, and spend twice as much on wine compared to meat.
- Cluster 3 (High Spenders): Non-parents across all age groups who engage online and through catalogs. They ignore deals but show some interest in promotions and are easily converted.
- Cluster 4 (Deal Seekers): Educated parents who love discounts but not promotions. They engage heavily both online and in-store, spending over three times more on wine than meat despite low-to-medium income.
This segmentation provides key insights to tailor marketing strategies, optimize conversion rates, and enhance customer engagement across all groups.
Cluster Targeting
Based on the customer segmentation analysis, the following strategic recommendations are proposed to optimize marketing, conversion, and engagement efforts:
-
Cluster 0 (Low-Income Buyers):
- Implement affordable bundle deals on their preferred products (wine, meat, gold).
- Use retargeting ads to maintain engagement and drive conversions.
- Simplify the online purchasing process to reduce drop-offs.
-
Cluster 1 (Medium-Income, Low Spenders):
- Promote exclusive in-store discounts to encourage purchases.
- Offer first-time buyer incentives to increase online conversions.
- Leverage email marketing campaigns with deal-focused messaging.
-
Cluster 2 (The Engagers):
- Enhance loyalty programs with rewards for high online interaction.
- Invest in social media and influencer partnerships to deepen brand connection.
- Personalize offers based on their high wine expenditure.
-
Cluster 3 (High Spenders):
- Focus on premium product positioning rather than discounts.
- Strengthen catalog and digital marketing campaigns to increase engagement.
- Highlight exclusive or limited-edition product launches to drive urgency.
-
Cluster 4 (Deal Seekers):
- Develop targeted promotions and flash sales to maximize spending potential.
- Offer subscription models or loyalty perks to encourage repeat purchases.
- Ensure clear, engaging deal messaging in both online and in-store promotions.
By implementing these tailored strategies, the company can increase customer retention, optimize conversions, and drive revenue growth across all segments.
Strategic and Tactical Marketing Recommendations
When summed up, all of the recommendations for targeting individual clusters can be placed in 3 main categories: loyalty program, promotion communication, and special offers as bundles of products. Each of them is detailed in the following section, alongside steps and insights in how to effectively implement it into the marketing mix.
Initiative 1 - Gamified, point-based Loyalty Program
There are multiple reasons why a loyalty program (LP) is ideal for this retail chain. Firstly, LPs have a positive effect on consumer retention and reengagement of existing customers. While there are a few types of LPs, the recommended one implies the use of a reward point system, similar to the one used by Albert Heijn in the Netherlands or McDonalds. Here’s why:
- Allows the collection of personal data (f.e. preferred item categories, brands) and location data (f.e. brands bought at one location vs the others) → better tailoring of product promotion and discounts
- Generates a positive effect on customer retention (Zhang & Breugelmans, 2012)
- Reduces consumer interpurchase times by as much as 20% (Kivetz et al., 2006)
- Increases purchase frequency and store visits → increased attitudinal loyalty
How to implement it:
- Create an app with the available store catalog in which customers can log in, create their profile and generate their own digital loyalty card.
- Establish a point-based system for products (f.e. purchases of 10 euros give customers 2 points).
- Based on the personal and location data collected, use machine learning-powered recommendation systems, such as collaborative filtering, to create special offers, such as 1+1 offers and discounts, which can be redeemed in exchange for the points.
- Make the system and app feel friendly, seamless, and frictionless by applying UX and gamification principles.
- Leverage the notifications marketing to create the Point Pressure Effect in consumers, which accelerates their purchase behavior as they get closer to redeem rewards.
The topic of Loyalty Programs is a rather complex topic, which by itself requires more attention. I covered the subject of redesigning Loyalty Programs for B2C and retail more in depth in the article where I recreated the entire program for Rituals, the renowned cosmetics and self-care retailer.
Initiative 2 - Targeted Communication
Communication is key for engaging with consumers. The key in today’s age to grab a consumer’s attention, at least in the digital realm, is through personalization . It has been observed that personalized communication boosts the consumer-brand connection, motivating customers to reengage and improve the retention. According to Lindsay (2014), it can increase profitability by 26% and improve market capitalization by 12% . Here’s how to implement it:
- Personal content and deals via email - the typical “Hey {name}, “ won’t cut it anymore. Marketers need to rethink their approach by implementing email marketing tactics based on customer segments. For example, John, who is a High-Spender, would engage more with an email that features a new, premium red wine, perfect for dinner nights, than with an email sent to Anne, a Deal-Seeker, who would engage more with emails featuring limited-offer discounts for sweets and fish.
-
Notifications and Mobile Marketing can be a gold mine of opportunities. Here’s how:
- use the branded app to send notifications to customers about deals of brands or product categories they are interested in.
- based on their location and the most visited store, the messaging can be even more targeted by taking into consideration store-specific special offers and available stock.
- use their demographic details to adapt the communication styles (f.e. use Gen Alpha and Gen Z slang and emojis, be friendly for Millennials and respectful for Baby Boomers)
- leverage the Point Pressure Effect (PPE) to make consumers reengage with the LP
- Appeal to their needs and desires - using the demographical and the behavioral data collected through the app and the loyalty program, adapt the messaging to include messaging that recognizes their needs and status, and puts emphasis on the potential rewards .
For instance, here’s how I would do it via email:
Subject 1: [Name], exclusive wine selection for you
vs.
Subject 2: [Name], 48-hour flash sale—30% off wine

Body dynamic content:
- Cluster 0: "Buy [preferred meat], get premium wine FREE"
- Cluster 3: "Introducing our limited-edition [region] wine collection"
- Cluster 4: "Your favorites on sale—save $XX today"
Requirements:
- CRM with segmentation capabilities (or CDP integration)
- Email service provider with dynamic content blocks
- Recommendation engine API for product suggestions
- LLM integration for creative variation at scale (optional efficiency gain)
Of course, companies would like to avoid LLMs as they pose confidentially risks. However, with the increasing use of local Large Language Models (LLMs), that can be run on local devices (i.e. individual’s and company’s laptops), the workload can be cut in half when they are implemented adequately in the daily task processes. These models do not send the data to a server, they can be easily configured and everything is securely stored on the device.
Initiative 3 - Product Bundling & Discounts
Bundles can be another effective strategy to generate demand, especially for certain clusters. The following tactics can be useful to target especially the Low- and Medium-Incomers and the Deal Seekers.
Tactic A: Bundles and Zero pricing Bundle items that complement each other. However, it’s not that simple - it is also key how it is framed. For low-priced items, instead of communicating a bundle price, show one product as free, as consumers’ willingness to pay for a product is higher when the product is offered for free rather than discounted (Palmeira & Srivastava, 2013).
In the case of premium products, the anchoring effect focused on the focal product can be used to generate a higher perceived value of the bundled item. For instance, a higher quality beef meat cut, might be bundled with a red wine, offered for free. The consumers’ psyche will take the price of the premium meat as a comparison reference for the wine - and since the meat is premium, they would consider the wine is also of higher quality. As such, pair cheaper items (in this case the wine) with a more expensive, higher quality product (such as a premium beef cut).
Contrary to the expectations, bundling would not devalue the perceived quality of the product, and it would actually increase the willingness to purchase after the promotion is over, as shown by Palmeira and Srivastava (2013), especially when they are paired with premium products.
On short: Application:
- Instead of “$15 wine + $25 meat = $35 bundle”
- Frame as “Buy $25 premium meat, get $15 wine FREE”
Psychological Mechanism:
- “Free” has disproportionate motivational power (Shampanier et al., 2007)
- Consumers anchor on premium item price, perceive free item as high-value
Implementation:
- Apply to complementary products (wine + meat, pasta + sauce, bread + spread)
- Pair lower-margin items (wine) with higher-margin anchors (premium meat)
- Communicate in-store, email, and web with “FREE” prominent
Tactic B: 1 + 1 Deals for Category Penetration This option should be applied to the same product category (f.e. buy one bottle of wine and get another one for free) and is especially useful for lower-quality products that are placed next to more expensive, same product category brands. This is a highly efficient strategy as the consumers will use the price of one unit of the 1+1 deal as the anchor point, assessing it as such:
- Consumers will compare the cheaper product with the more expensive one
- Consumers will assess the 1+1 promotion
- “This deal will give me 1 more product for free, even though it’s lower quality, so I’ll pick it!” The reason why this works is that (1) in retail, customers use the lower price as the anchor point for comparison and (2) consumers like free things (and this effects leads their choices, as observed by Shampanier et al., 2007).
On short: Application:
- “Buy 1 bottle of [mid-tier wine], get 1 FREE”
- Position mid-tier products next to premium alternatives (anchoring)
Psychological Mechanism:
- Consumers compare 1+1 offer to higher-priced adjacent product
- Lower unit price becomes anchor (not 2-bottle price)
- “Free” effect drives selection over premium single bottle
Implementation:
- Strategic shelf placement (mid-tier + premium adjacency)
- Clear signage: “1+1—that’s only $X per bottle!”
- Apply to wine, packaged goods, lower-margin categories
Methodology & Approaches for Customer Segmentation Analysis
This section provides technical detail on data processing, feature engineering, dimensionality reduction, and clustering methodology. Marketing managers may skip to Strategic Recommendations; MMM practitioners and data scientists will find model selection rationale and validation metrics here.
The project leveraged Python for EDA and data analysis. Google Colab was used for version control. Principal Component Analysis (PCA) was employed for dimensionality reduction. The following libraries and technologies were used:
- Data analysis → NumPy, Pandas
- Vizualizations → MatplotLib, Seaborn, Plotly
- Models & Metrics → Sklearn
Data Collection & Preparation
The dataset is publicly available on Kaggle. After the initial download, the initial EDA started by removing the entries with the missing values, as they accounted for only 24 records and thus had no impact on the end result. Using Descriptive statistics measurements, the basic information about customers was extracted:
- The average year of birth is 1968 → the average customer is a Gen X
- The aevrage household income per year is around $52.247
- 1 in 2 customers have a teen at home, and 44% at least one child
- The newest customer’s enrolment date in the records is 29.06.2014
- The oldest customer’s enrolment date in the records is 30.07.2012
Data Cleaning & Feature Engineering
A number of new features were added:
- Customer_For - shows for long how the customer has been a client by subtracting the date of enrolment from the most recent date
- Age - consisting of the current year (2024) minus the year of birth
- Amount_Spent - showcasing the amount of money a customer spent on all available product categories
- Living_With - out of “Marital_Status” to extract the living situation of couples.
- Children - to indicate total children in a household that is, kids and teenagers, by adding Kidhome and Tennhome together
- Family_Size - to showcase the household situation
- Is_Parent - to indicate parenthood status
- Education - simplifying by combining the available information in 3 categories
- Spending_Ratio - the proportion of spending on each product relative to total spending. This will help identify customers’ product preferences.
- Total_Accepted_Offers - this will showcase how many campaigns a customer has responded to, to measure their overall responsiveness to promotions.
- Engagement_Score - calculated as [Total Purchases + Num of visits (across all channels)] / Recency
The next step was to identify the outliers. For this, a number of graphs were created, which can be seen below, as they allow to see the distribution of datapoints.

Based on this, 25 outliers have been identified and deleted. In addition, a number of columns that were duplicates of existing ones have been removed. After this, a correlation matrix was made to assess the relationships between features.

A number of ideas can be extracted from this matrix:
- The products bought have a medium correlations, in the range of 50%-60%.
- Amount spent is significantly positively correlated with Income, Wines, Meat and Engagement Score.
- Income has a significantly positive correlation with the product types bought, Meat and Wine having 69%.
- A medium negative correlation between Income and the number of website visits per month.
While conducting further EDA and applying descriptive statistics concepts, the following plots were created. From this data, we can gather that most customers either a partner or a partner and at least 1 child, finished university, and are Gen X.

The candle bars show the impact of education on Amount_Spent, Engagement_Score and household Income. It seems like Undergraduates tend to be a bit younger than Graduates and Postgraduates, and tend to spend less on products, engage less with the business across all channels, and their household income tends to be less than those of Graduates and Postgraduates

Data preprocessing and PCA
After all the unrelated columns were dropped, the remaining features were dimensionally reduced to fit PCAs needed to create an initial clustering plot, which can be seen below. The 3D projection shows the variance ratio by how the features vary.
- PC1 captures the highest variance in the dataset
- PC2 the second highest variance, orthogonal to PC1
- PC3 the third highest variance, orthogonal to both PC1 and PC2
This PCA stands at the basis of the next cluster analysis.

Clustering Approaches
2 clustering approaches were used in order to compare each other and choose the best one: K-Means and AGNES.
K-Means It was identified that the elbow point is at k=4, meaning that the most optimal number of clusters for k-Means is 4.

Using this, the model was built and the following cluster plot has been created. The following metrics were resulted:
K-means Silhouette Score: 0.3876 K-means Davies-Bouldin Index: 0.9715 K-means WCSS: 7362.3111

Agglomerative Clustering (AGNES) Based on the elbow analysis, seen below, it was established that the optimal number of clusters for AGNES was 5, differing from k-Means.

The AGNES model provided the following output. As it can be seen, it created a 5th cluster.
The following metrics were resulted:
Agglomerative Silhouette Score: 0.3342 Agglomerative Davies-Bouldin Index: 1.0992 Agglomerative WCSS: 6876.7987


Model Selection: AGNES vs K-Means
Interpretation of the metrics - Based on the calculated metrics, K-Means seems to perform slightly better when it comes to cluster separation and compactness. Nonetheless, the results are similar in their composition.

From the above Cluster Heatmap, it can be interpreted that while the models align on certain cluster characteristics, the off-diagonal values such as K-means cluster 2 spreading across Agglomerative clusters 2 and 4, show that some points are grouped differently. This divergence might suggest that Agglomerative Clustering is better at capturing substructure within these groups.
Marketing Application Rationale: Despite K-Means showing slightly better separation metrics, AGNES was selected because:
- Captures substructure within high-value segments (critical for personalization)
- 5 clusters provide more granular targeting than 4
- Better aligns with marketing team’s campaign capacity
- Hierarchical structure allows roll-up reporting for executives
Next steps
Looking back at the recommendations, here’s how the retailer can improve their marketing tactics even more:
- Continuous data monitoring to refine the approach and capitalize on emerging trends.
- Adopting and optimizing marketing tactics, such as the ones previously described, to encourage purchasing across undeveloped customer segments.
- Conduct more market research to gain more insight into the behavioral aspects of the consumers.
- Using the collected behavioral data, create Sinus Milieus and segment the customers based on both demographics and psychographics to allow even more effective targeting.
Let’s Discuss Your Needs
Whether you need customer segmentation analysis, marketing mix modeling, or attribution optimization, I combine statistical rigor with marketing strategy expertise.
Get in Touch
💼 LinkedIn: https://www.linkedin.com/in/alexandru-constantinescu-6a18b6117/ 💻 GitHub: https://github.com/Meah01
Core References
Primary Data Source
Loyalty Programs
- Kopalle et al. (2012) - The Joint Sales Impact of Frequency Reward and Customer Tier Components of Loyalty Programs
- Nishio and Hoshino (2022) - Joint modeling of effects of customer tier program on customer purchase, duration and amount
Pricing
- Shampanier et al. (2007) - Zero as a Special Price: The True Value of Free Products
- Palmeira and Srivastava (2013) - Free Offer ≠ Cheap Product: A Selective Accessibility Account on the Valuation of Free Offers
Personalization
- Platmatier et al. (2018) - Customer Engagement Marketing - Chapter 4: Customer Engagement Through Personalization and Customization
- Lindsay, G. (2014). The Economics of Personalization. MIT Technology Review
Advanced Segmentation Methodologies
- Sinus-Institut. (2024). Sinus Milieus Methodology