- ~246konline touchpoints analysed
- 13.7%overall conversion rate
- 0.8%conversion to the focal agency
- 10% / 57.5%journeys touching own brand / a competitor
Context
A Dutch travel agency wanted to understand what makes an online customer journey end in a booking. The dataset held about 246,000 individual touchpoints across channels and devices, plus customer demographics.
The questions
- Attribution. Which touchpoints drive a successful journey?
- Segmentation. How do customers differ in the way they search?
- Sequence. Does the order of touchpoints matter?
Approach
- Data processing. Cleaned the raw touchpoints and built journey-level features: length, duration, touchpoint mix and device. Fixed duplicate columns and case-sensitive merge keys. Capped outliers (journey duration at 65 days, length at 750 touchpoints). Handled left-truncation in the sales data.
- Attribution. Logistic regression of conversion on touchpoint-type composition.
- Segmentation. PCA followed by k-means.
- Sequence. Adapted the affect, cognition and experience (ACE) hierarchy of effects to travel, with proportional journey staging (20/60/20).
- Everything is reproducible in an R Markdown notebook, presented to a managerial audience.
What I found
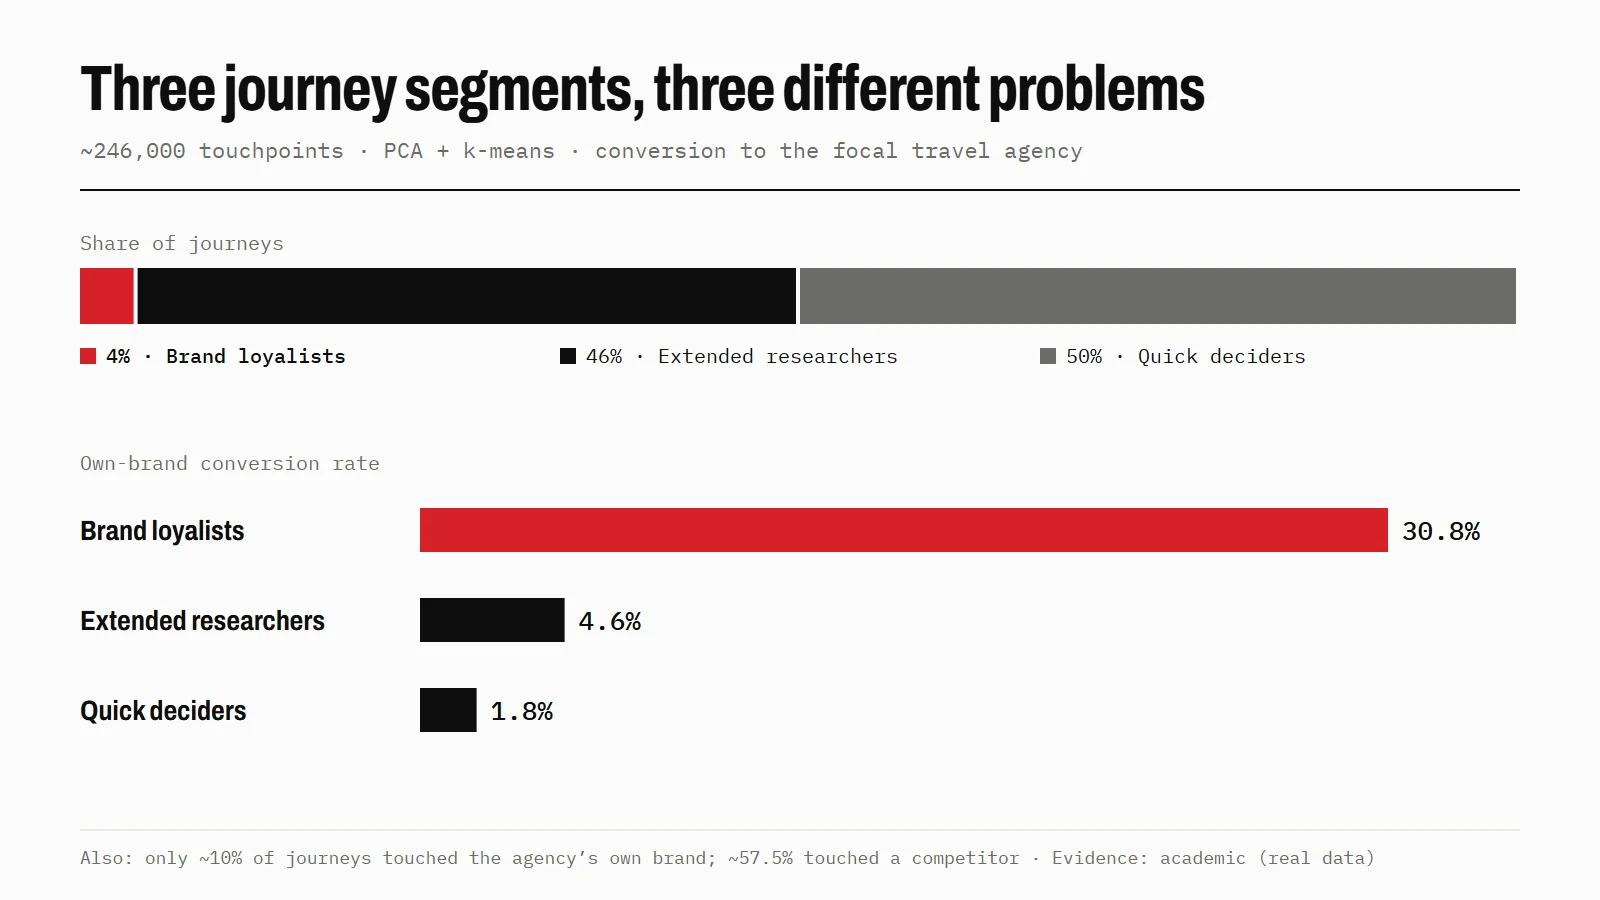
- A visibility problem, not a conversion problem. Only about 10% of journeys included the agency’s own brand, while about 57.5% included a competitor. Overall conversion was 13.7%, but only 0.8% went to the agency.
- Converters search long. A median of about 230 touchpoints over about 41 days. That fits a high-involvement, hedonic purchase.
- Three segments:
- Brand Loyalists (~4%): intensive journeys, 30.8% own-brand conversion.
- Extended Researchers (~46%): long, exploratory journeys, 4.6% conversion.
- Quick Deciders (~50%): short, functional journeys, 1.8% conversion.
Recommendation
Invest in visibility (SEO, SEA and comparison sites) before tuning conversion sequences, and aim that effort at the Extended Researchers. They are nearly half of all journeys and already convert at a rate worth growing.
Limits
This is one agency’s data in one time window. The attribution is correlational. The segment boundaries depend on the features chosen and the number of clusters, which I checked but which remain modelling choices.