- 263active stockists
- 3regional depots (Accra/Kaase, Kasoa, Takoradi)
- 21manual routes used as the baseline
- ~10%lower cost on average across the three plans
Context
FanMilk, Danone’s frozen dairy business in Ghana, delivers to 263 stockists from three regional depots using its own 9-tonne freezer trucks, three per depot, and hires third-party (3PL) trucks when those run out. I worked on its distribution network from June to August 2026 as a freelance subcontractor for 4Growth Consulting, which ran the wider project.
The routes were drawn by hand. There were 21 of them, and nobody could say whether they were good. I was asked to redesign them, and to deliver the tool as an offline Windows application, because the client’s security policy rules out live calls to outside services.
The question
Three decisions sit inside “plan the deliveries”, and they depend on each other:
- Territories. Which stockists belong to which depot and which truck’s area?
- Frequency. How often does each stockist need a visit, and on which days?
- Routes. Given the day’s stops, which truck goes where, and in what order?
Approach
I chose a decomposed pipeline over one large vehicle-routing model. At this scale it is easier to audit, and a planner can see why every stop landed where it did.
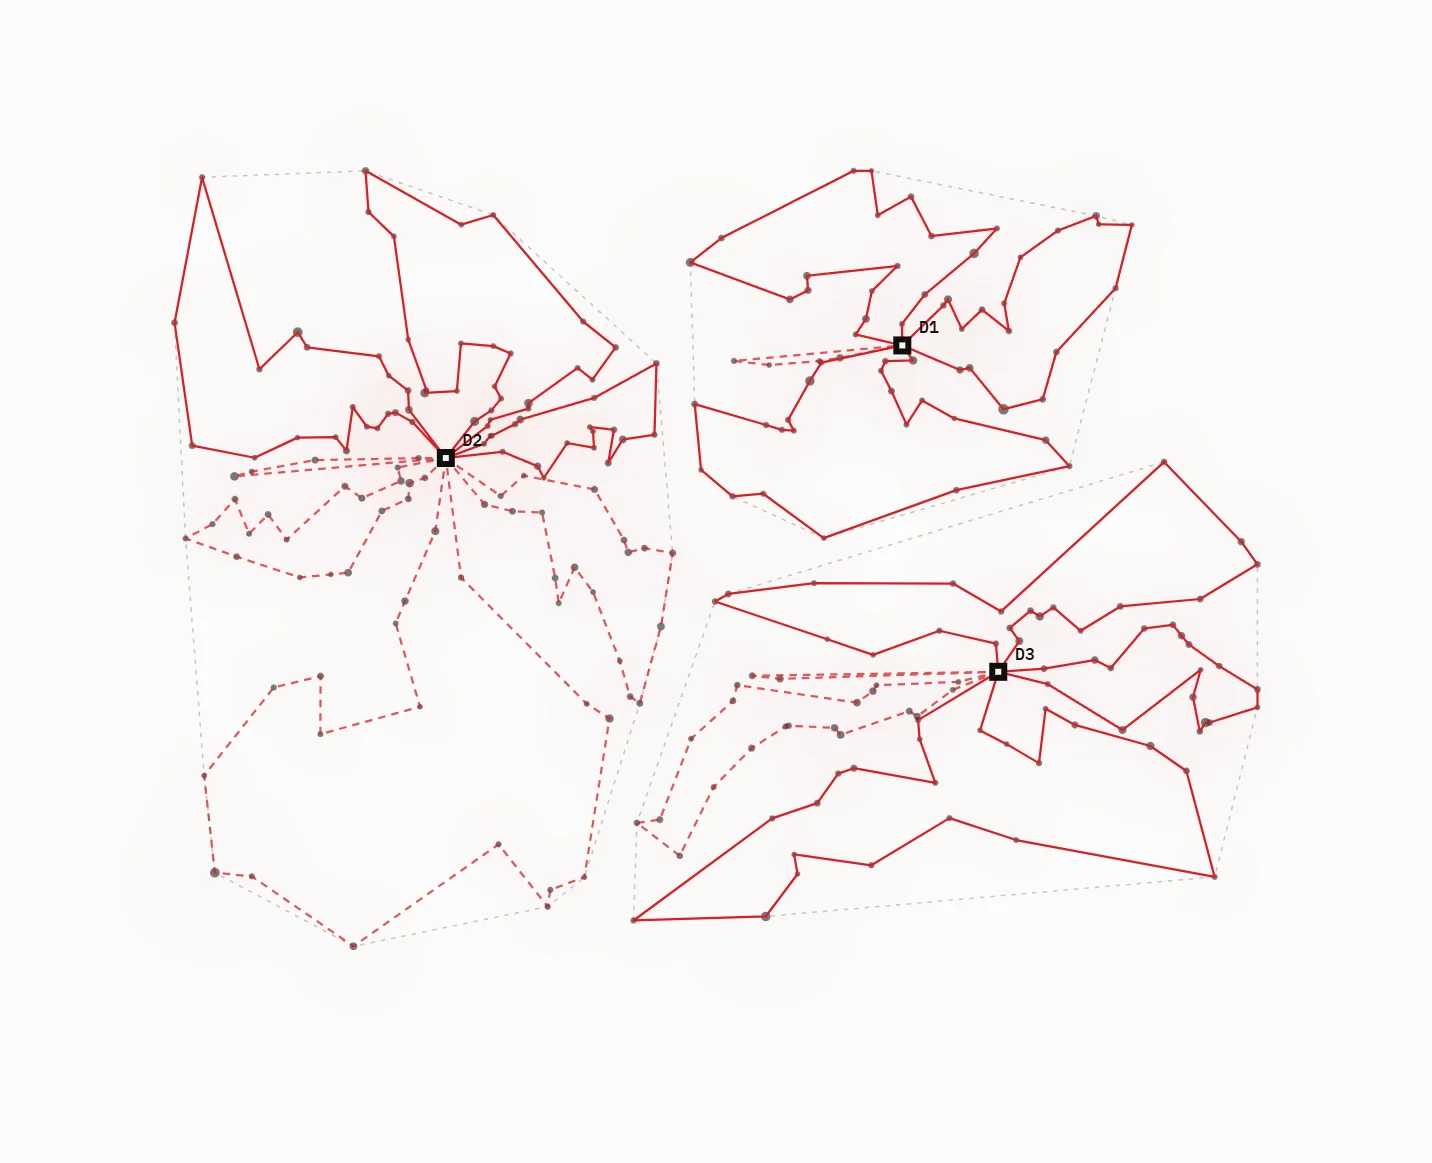
- Territory design. K-medoids clustering followed by an integer programme that balances territories on each stockist’s peak monthly weight demand. The number of territories comes from demand and target fleet utilisation, capped by the trucks actually available.
- Inventory routing. Stockists are tiered by visit frequency and locked to delivery days, using the client’s monthly demand forecasts for June to December 2026.
- Vehicle routing. First-fit-decreasing bin-packing (by geography or by weight) with dynamic driver-hour caps, then each route is sequenced with nearest-neighbour and improved with 2-opt.
- Fleet rules. The client’s own trucks go first. Anything over capacity spills automatically to 3PL vehicles.
- Distances. Road-network distances and route geometry come from OpenRouteService, with caching and batched requests. Where OpenStreetMap is thin outside the cities, the tool falls back to straight-line distance with a road-correction factor.
Planners get four objectives to choose from (shortest distance, fewest truck-days, fewest hours, balanced). A what-if engine compares up to five scenarios side by side, for example a depot losing a truck. Output is an Excel route sheet in the client’s own template, next to the manual baseline.
What I found
- GPS, not addresses. Most stockists have no usable street address, so the whole data model keys on coordinates.
- One bad rule can wreck a plan. An early regional/local classification sent about 90% of territories into single long cross-region tours. I traced it to the classification itself, wrote up the root cause and replaced the rule, rather than patching each symptom downstream.
- Auditability matters more than a perfect optimum. The decomposed design lets a planner override one stage, for example moving a stockist between territories, and re-run only what follows.
Results
I delivered three optimised plans, one per goal: fewest driving hours, lowest fuel cost, and a balance of the two. Benchmarked against the client’s existing routes, they came out about 10% cheaper on average across the three scenarios. The pipeline is covered by 145+ automated tests.
The engagement ended in August 2026. I’m now building the same routing engine into GeoRetail Intelligence Suite, the geospatial analytics product I co-founded, and extending it with open data.
Limits and next steps
- Road data in rural Ghana is incomplete. The straight-line fallback is a stop-gap, not a model of the real road.
- Demand forecasts come from the client. Forecast error feeds straight into territory balance, so the next step is a sensitivity check on forecast ranges.
- The other GeoRetail modules (demand surface, retail footprint, competitors, catchment, site selection) build on the same data layer and are next on the roadmap.
The map at the top is illustrative and generated by the same methods on made-up data. The client’s data is never shown.